Background
Highway toll roads, bridges and tunnels are included in the industry category referred to as toll roads. A toll road may include service areas which will generate additional revenues. Such projects
- Are technically simple but may become a little more complex if the terrain is difficult (e.g. bridges and tunnels)
- Have a capital cost that is very dependent on terrain and rights of way, and can be difficult to predict
- Contain little equipment and material which may need to be imported
- Need a reasonably high volume of traffic to make them economically viable
- Have traffic forecasts which are difficult to predict
- Revenues usually collected directly from motorists through tolls. These usually go to the operator but sometimes they are transferred to the government who reimburses the operator with an availability arrangement. If there are no toll gates the government authority pays the operator with either a) shadow tolls or b) an availability arrangement
- Tolls may be collected at toll booths, via electronic toll collection or a combination of the two.
- Serve a market which is price elastic. The usage will depend on the toll rate and the model should include a formula for the usage which contains an elasticity factor
- Are subject to road resurfacing and/or additional lanes which may be required during the life of the project/concession
- May be partially funding by a section of the highway which is opened to the public before the entire project is completed
- Contain straightforward taxation calculation.
Modelling Considerations
The basic design of the highway is usually carried out by a state entity. The market survey is an essential component of this design. The capital cost estimate is based on a bill of materials and is heavily dependent on the terrain in which the highway is located. The model can only be developed and used after this design and cost estimate have been completed.
The design is for a specified level of service (LOS). If the demand is expected to increase with time, the model should estimate the date when an additional lane is needed to ensure that the specified LOS is maintained. In order to do this, the model needs to contain the formulae to generate the speed flow curve with LOS criteria. The model should use this information to produce a chart illustrating the vehicle density over time and the predicted dates when the operator must invest in additional lanes. The information will also be used to calculate the required target for the sinking fund to handle this major additional investment.
How Promoter handles Toll Road projects
- Promoter carries out a simple design and cost estimate.
- It determines the number of lanes for each operating period through the life of the project in order to maintain a required level of service. It gives the user the option to make an additional investment and add more lanes when necessary.
- It contains procedures for handling periodic road resurfacing and the sinking funds to ensure that funds are available
- It contains a variety of features for handling State support.
- The user places key coordinates so that Promoter can illustrate the network.
- It diverts net operating revenues from early opening to fund parts of the project still under construction
Promoter uses the following speed flow curve

It then produces a vehicle density chart over the life of the toll road in order to determine the time when additional lanes must be added for a specified level of service (LOS).

Typical Project Cash Flows

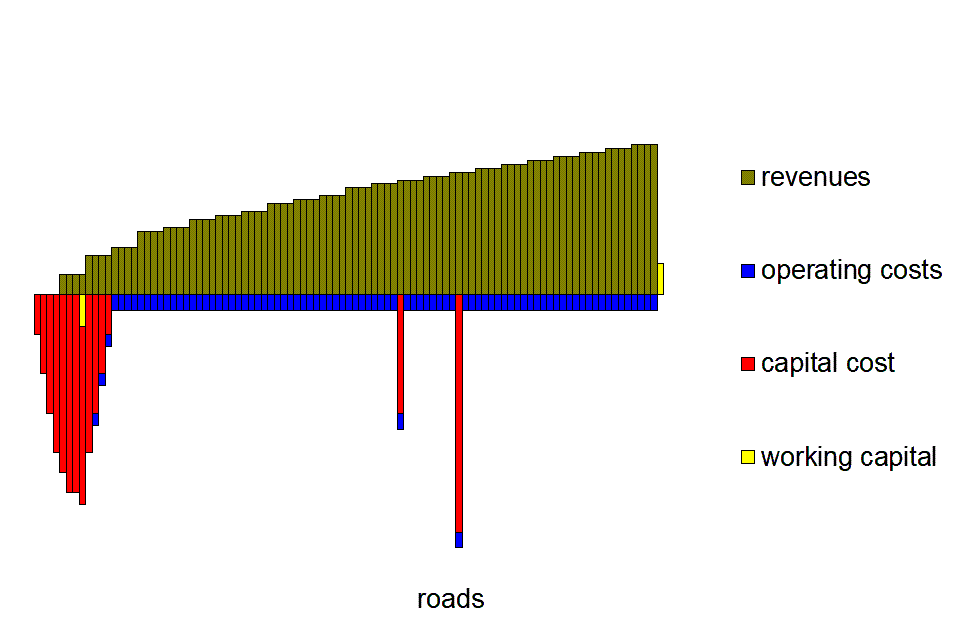
The revenues typically increase over the life of the project. They may reach a plateau if the demand exceeds the design capacity. And there may be a step wise increase in the revenues as the operator increases the tolls. The operating and maintenance costs are usually a small fraction of the revenues. There will be significant additional costs due to
- resurfacing at intervals which depend on the type of usage (typically 15 to 30 years).
- expansion for the addition of extra lanes in order to ensure a specified level of service. The interval will depend on the rate at which the usage increases